Performance Overview
Al Rajhi Bank (ARB) continued to build on the momentum and growth opportunities from 2011 delivering strong results in an ever-increasing competitive environment. ARB continued to lead the banking sector across all key financial indicators and metrics.
- No. 1 in profitability
- No. 1 in profit rate
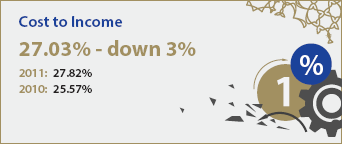
- No. 1 in cost to income ratio
- No. 1 in loans and advances
- No. 1 in market capitalization among banks in the GCC
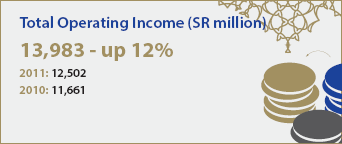
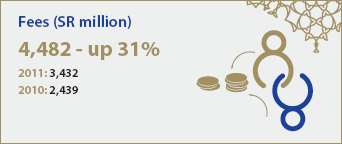
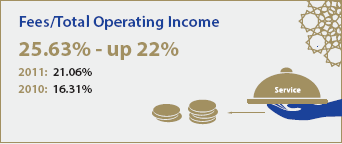
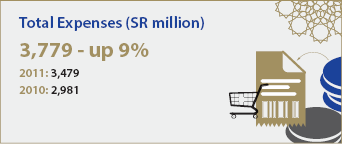
ARB's operating income was up 12% year on year despite a further compression in NIMs by 66 Bps, driven by a phenomenal 31% increase in fees and strong retail asset growth. Operating costs were well managed with a stable cost to income ratio of 27%.
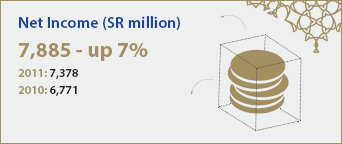
A year on year increase in Non-Performing Loans with a corresponding increase in provisions resulted in ARB achieving a 7% increase in Net Profits for 2012.
| 2012 | 2011 | 2010 | 2009 | 2008 | |
| Operating Income (SR million) | 13,983 | 12,502 | 11,661 | 11,505 | 10,575 |
| Operating Expenses (SR million) | 6,098 | 5,124 | 4,890 | 4,738 | 4,050 |
| Net Income/Profit (SR million) | 7,885 | 7,378 | 6,771 | 6,767 | 6,525 |
| Profit/Share (SR) | 5.26 | 4.92 | 4.51 | 4.51 | 4.35 |
| Dividends per Share (SR) | 3.25 | 3.25 | 3.00 | 2.75 | 3.00 |
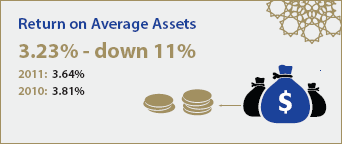
| Return on Assets (%) | 3.23 | 3.64 | 3.81 | 4.05 | 4.51 |
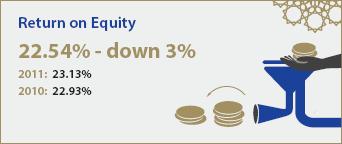
| Return on Equity (%) | 22.54 | 23.10 | 22.93 | 24.27 | 25.77 |
| Net Investment (SR million) | 40,880 | 38,803 | 28,247 | 27,139 | 26,661 |
| Financing, net (SR million) | 171,941 | 140,313 | 120,065 | 112,148 | 109,293 |
| Customer Deposits (SR million) | 221,343 | 177,733 | 143,064 | 122,862 | 118,741 |
| Shareholders' Equity (SR million) | 36,469 | 33,489 | 30,318 | 28,741 | 27,032 |
| Total Assets (SR million) | 267,383 | 220,731 | 184,841 | 170,731 | 163,373 |
| Capital Adequacy Ratios (%) | |||||
| - Tier I Ratio | 14.68 | 14.71 | 15.23 | 13.82 | 14.60 |
| - Total Capital Ratio | 19.83 | 20.03 | 20.63 | 19.30 | 21.39 |
| Credit Ratings | |||||
| - Capital Intelligence | AA- | AA- | AA- | A+ | A+ |
| - Moody's | A1 | A1 | A1 | A1 | A1 |
| - S & P | A | A | A+ | A+ | A+ |
| - Fitch | A+ | A+ | A+ | A+ | A+ |